In part 1 we’ve looked at a way to fix incorrect drill-through results when modifying the filter context in measures. Incidentally the same scenario of multiple relationships to a table (which is formally called “role-playing dimensions”) is also the topic of another blog post in which I show a more user-friendly way to implement role-playing dimensions. Incorporating that method makes it a little more tricky to get the correct drill-through results, and that’s what we’ll talk about in more detail here.
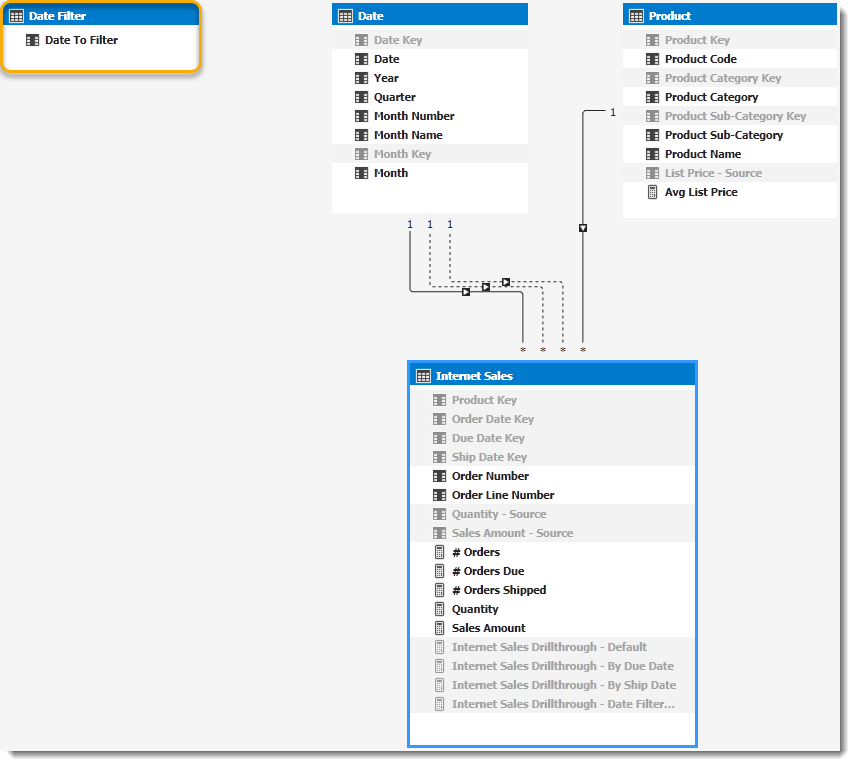
Following the methods described in the role-playing dimensions post, our Tabular model will look like this with a filter dimension/table which we can use to control the date perspective we’d like to see:
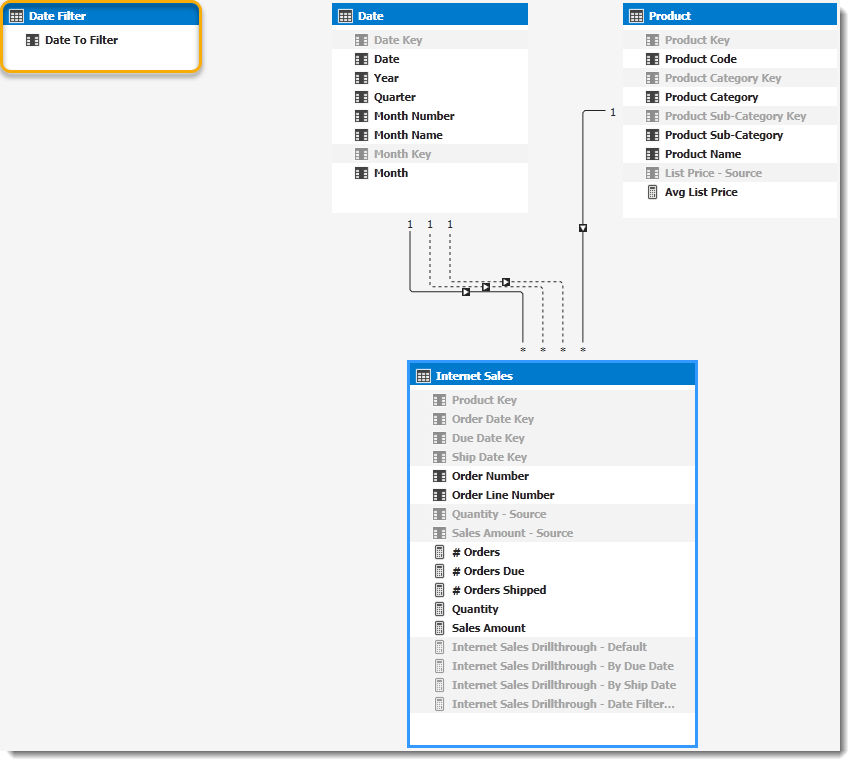
The Quantity measure formula (below) incorporates our new Date To Filter value and modifies the relationship used between the Date and Internet Sales tables/entities to produce the correct result in Excel…
Quantity:=
VAR
    SelectedDateFilter =
        SELECTEDVALUE
        (
            'Date Filter'[Date To Filter]
        ,   "Order Date" -- default
        )
VAR
    UseOrderDate =
        CALCULATE
        (
            SUM('Internet Sales'[Quantity - Source])
        ,   USERELATIONSHIP('Internet Sales'[Order Date Key], 'Date'[Date Key])
        )
VAR
    UseDueDate =
        CALCULATE
        (
            SUM('Internet Sales'[Quantity - Source])
        ,   USERELATIONSHIP('Internet Sales'[Due Date Key], 'Date'[Date Key])
        )
VAR
    UseShipDate =
        CALCULATE
        (
            SUM('Internet Sales'[Quantity - Source])
        ,   USERELATIONSHIP('Internet Sales'[Ship Date Key], 'Date'[Date Key])
        )

RETURN
    SWITCH
    (
        SelectedDateFilter
    ,   "Order Date"
    ,   UseOrderDate
    ,   "Due Date"
    ,   UseDueDate
    ,   "Ship Date"
    ,   UseShipDate
    ,   UseOrderDate -- default
    )
Why can we not use the same pattern for the drill-through?
Good question! The main reason we cannot use the same pattern we’ve used for the measure in the drill-through results is because we’re trying to return a table and not a single measure value.
The return value of the SWITCH() function in DAX is a scalar value, and you will get an error if you try to use anything that returns a table, even if you use variables to temporarily store the results. The same is also true of the IF() function, and we’ll have to come up with a way to circumvent these limitations and return a table based on some conditional logic.
How do we do it?
Disclaimer: This is the “best” method I’ve found thus far and based on my experimentation, but it’s not perfect. Performance could be slow if your drill-through table is very large, and I’d be very interested to know if you have a better and/or faster solution.
Ok, now that that’s out of the way…let’s look at the solution.
The first step is to create a “dummy” variable (as before), which we will use to define the Detail Rows Expression and reuse as necessary.
-- This is the "dummy" measure that will define all the attributes we'd like to return in the drill-through
Internet Sales Drillthrough - Date Filter Aware:= 1
In the definition of the Detail Rows Expression we need to determine which value is selected from our Date Filter and then use that value somehow to return the appropriate results…and that’s the tricky part!
Step 1: Get the selected value from the filter dimension
This step is similar to what we’ve done in the definition of the measure, so nothing new here and we’ll assign the value to a variable (as we did before).
VAR
    SelectedDateFilter =
        SELECTEDVALUE
        (
            'Date Filter'[Date To Filter]
        ,   "Order Date" -- default
        )
Step 2: Return the detail rows that match our selection
VAR
    UseOrderDate =
        FILTER
        (
            DETAILROWS('Internet Sales'[Internet Sales Drillthrough - Default])
        ,   SelectedDateFilter = "Order Date"
        )
The magic happens here, where we use the value from our first variable (SelectedDateFilter, which is the value that the end user selected as date perspective) to ensure that we get an empty result for the detail rows if it doesn’t match our selection. We can use the FILTER() function to achieve this because we’re filtering on a scalar value, and we’ll do the same for Due Date and Ship Date.
Step 3: Combine the results
As a last step, we combine the results into one table by using the UNION() function.
VAR
    CombinedTables =
        UNION
        (
            UseOrderDate
        ,   UseDueDate
        ,   UseShipDate
        )
Adding the components together, here’s what the entire Detail Rows Expression looks like:
VAR
    SelectedDateFilter =
        SELECTEDVALUE
        (
            'Date Filter'[Date To Filter]
        ,   "Order Date" -- default
        )
VAR
    UseOrderDate =
        FILTER
        (
            DETAILROWS('Internet Sales'[Internet Sales Drillthrough - Default])
        ,   SelectedDateFilter = "Order Date"
        )
VAR
    UseDueDate =
        FILTER
        (
            DETAILROWS('Internet Sales'[Internet Sales Drillthrough - By Due Date])
        ,   SelectedDateFilter = "Due Date"
        )
VAR
    UseShipDate =
        FILTER
        (
            DETAILROWS('Internet Sales'[Internet Sales Drillthrough - By Ship Date])
        ,   SelectedDateFilter = "Ship Date"
        )
VAR
    CombinedTables =
        UNION
        (
            UseOrderDate
        ,   UseDueDate
        ,   UseShipDate
        )

RETURN
    CombinedTables
Can this be made simpler with calculation groups?
If you’re using Analysis Services 2019 (or later) and Tabular models with compatibility level 1500 or higher, you can use calculation groups to simplify the development and maintenance of scenarios like role-playing dimensions. At the moment calculation groups do not make provision for Detail Rows Expressions, and while I would recommend using calculation groups to replace the filter dimension you would still have to implement this workaround to ensure the correct drill-through results.
Want to download the Visual Studio project that shows the solution? Get it from my GitHub repo.