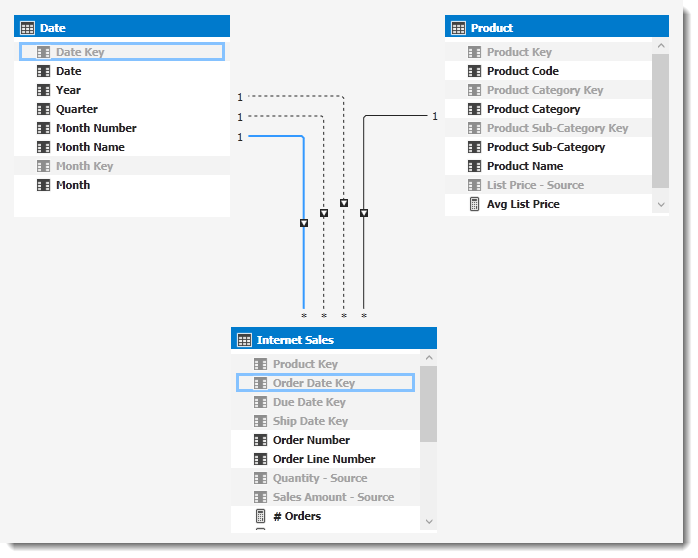
The Detail Rows Expression property of a measure in a Tabular Model determines what attributes are returned as drill-through action, i.e. the results you see when you double-click on the measure in Excel. To illustrate, I’ve created a small tabular cube using the Adventure Works DW sample database:

It’s a relatively straight-forward model with one fact table (Internet Sales) and two dimensions (Date, Product). Of interest here is that we have multiple dates in our fact table (Order Date, Due Date & Ship Date) for which we have to create relationships to our Date dimension. As you can see from the highlighted relationship, only one can be active and in this case it is the Order Date relationship…which means it will be used by default and we would have to activate the other relationships on-the-fly if we need them. Let’s create a few measures that will count the number of orders, orders due and orders shipped…
# Orders := DISTINCTCOUNT('Internet Sales'[Order Number])

# Orders Due :=
CALCULATE
(
    DISTINCTCOUNT('Internet Sales'[Order Number])
,   USERELATIONSHIP('Internet Sales'[Due Date Key], 'Date'[Date Key])
)

# Orders Shipped :=
CALCULATE
(
    DISTINCTCOUNT('Internet Sales'[Order Number])
,   USERELATIONSHIP('Internet Sales'[Ship Date Key], 'Date'[Date Key])
)
The # Orders measure doesn’t require anything fancy, because we want to associate it with the Date entity/dimension via the default relationship (on Order Date Key). For the other two however, we need to activate the relevant relationship in order to see the correct results when looking at the data by date, month or year. The USERELATIONSHIP() function in DAX gives us the ability to do just that, and this is what we’ll see in an Excel pivot table connected to our cube:
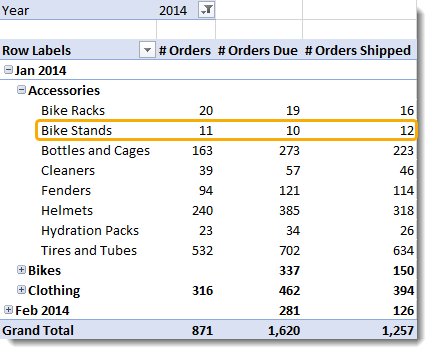
Everything looks good so far, so let’s zone in on the highlighted row for Bike Stands. A typical next step as an end user would be to see the detailed information for one of our measures, and assuming we didn’t change the Detail Rows Expression property of the measure we will see the following drill-through results if we double click on the # Orders for Bike Stands:

There’s a few things worth pointing out from the results:
- We’re seeing 11 distinct order numbers which is what we expect <happy dance/>
- Attribute names are exactly as they are in the model, with the table/entity as prefix. Not very user-friendly…
- Attributes used in relationships (and hidden) are not shown but other hidden attributes like Quantity – Source and Sales Amount – Source are. This is a little scary, because we may have hidden some sensitive information that will now be shown to anybody with access to the cube.
Let’s see what happens if we drill-through on the # Orders Due for Bike Stands…

We get the exact same results as before?! Instead of seeing 10 orders that were due in Jan 2014, we are seeing the 11 orders placed in Jan 2014…
What’s happening here?
If you run a trace when drilling through in Excel (you could use DAX Studio), you will see that the query generated by Excel honors the filter context, i.e. the filters coming from outside the measure definition, which is the filters applied in our Pivot table (Year, Month, Product Category & Product Sub-Category). But it is not aware of the filters we applied inside the query…in our case it was to override the relationship to the Date dimension.
You will see the same behavior if you use any filters in a CALCULATE() function, because the drill-through query runs independently and is not aware of or subject to our filter modifiers in the definition of our measure.
How do we fix it?
The short answer is that we have to define the Detail Rows Expression property of the measures to apply the same filters (USERELATIONSHIP() in our case), but I’m going to address the other issues (hidden attributes being shown) and implement a few best practices at the same time.
Defining the Detail Rows Expression for each measure independently is quite laborious (especially when you have to make changes), so the first thing we’re going to do is to create a “dummy” hidden measure which we will use to define the attributes we’d like to return. We’ll then re-use the Detail Rows Expression in other measures by using the DETAILROWS() function. Confused already? Let’s see what that looks like…
-- This is the base "dummy" measure that will define all the attributes we'd like to return in the drill-through
Internet Sales Drillthrough - Default:= 1

-- And this is what we'll use as Detail Rows Expression of this measure
SELECTCOLUMNS
(
    'Internet Sales'
,   "Order Number", 'Internet Sales'[Order Number]
,   "Order Line Number", 'Internet Sales'[Order Line Number]
,   "Order Date"
,   DATE
    (
        LEFT('Internet Sales'[Order Date Key], 4)
    ,   MID('Internet Sales'[Order Date Key], 5, 2)
    ,   RIGHT('Internet Sales'[Order Date Key], 2)
    )
,   "Due Date"
,   DATE
    (
        LEFT('Internet Sales'[Due Date Key], 4)
    ,   MID('Internet Sales'[Due Date Key], 5, 2)
    ,   RIGHT('Internet Sales'[Due Date Key], 2)
    )
,   "Ship Date"
,   DATE
    (
        LEFT('Internet Sales'[Ship Date Key], 4)
    ,   MID('Internet Sales'[Ship Date Key], 5, 2)
    ,   RIGHT('Internet Sales'[Ship Date Key], 2)
    )
,   "Quantity", 'Internet Sales'[Quantity - Source]
,   "Sales Amount", 'Internet Sales'[Sales Amount - Source]
)
In order to make use of the definition we’ve created in our “dummy” measure, we can use the following Detailed Rows Expression in the # Orders measure:
DETAILROWS([Internet Sales Drillthrough - Default])Simply put, the DAX function here says “Use the Detailed Rows Expression of the Internet Sales Drillthrough – Default measure” and the results in Excel looks promising as we now have a result set that only shows the attributes we want, and with user-friendly names. We could also have used the FORMAT() function to apply specific formatting to the Quantity or Sales Amount values.

Taking it one step further, let’s do the same and create a “dummy” measure that we could use to apply the Due Date relationship.
-- This is the "dummy" measure that will be used in cases where we want to apply the Due Date relationship
Internet Sales Drillthrough - By Due Date:= 1

-- And this is what we'll use as Detail Rows Expression of this measure
CALCULATETABLE
(
    DETAILROWS('Internet Sales'[Internet Sales Drillthrough - Default])
,   USERELATIONSHIP('Internet Sales'[Due Date Key], 'Date'[Date Key])
)
Note how we can re-use the table definition of our base “dummy measure” and simply override the filter context to use the correct relationship, and this method is especially useful because we will likely create other measures that need to use the same drill-through results. Defining the Detail Rows Expression of the # Orders Due measure similarly (below) we now see what we expected to see in the Excel drill-through results…the 10 Bike Stands orders that were due in Jan 2014.
DETAILROWS([Internet Sales Drillthrough - By Due Date])
I’ve recently blogged about a more user-friendly way to implement role-playing dimensions, and incorporating this method to ensure that we have correct drill-through results is a little more tricky. In part 2 we will look at that in more detail…
Want to download the Visual Studio project that shows the solution? Get it from my GitHub repo.
One thought on “Fixing incorrect drill-through results in Analysis Services – Part 1”